With the hardware done its time to tuneup the software driving the DSP. It is actually surprisingly easy to make a DSP like ADAU1701 sound bad if not understanding its design and limitations. The fist thing that has to be fully understod is found on page 29 in the ADAU1701 Data Sheet, it reads:
The serial port accepts up to 24 bits on the input and is sign-extended to the full 28 bits of the DSP core. This allows internal gains of up to 24 dB without internal clipping. A digital clipper circuit is used between the output of the DSP core and the DACs or serial port outputs (see Figure 29). This clips the top four bits of the signal to produce a 24-bit output with a range of 1.0 (minus 1 LSB) to −1.0. Figure 29 shows the maximum signal levels at each point in the data flow in both binary and decibel levels.
What does it tell us? That there is a 24 dB headroom in the DSP core but that this headroom will be clipped on the output if not attenuated down to 0 dB or below. I.e. if you got a 0 dB input signal and apply amplification to it (e.g. EQ, Room Correction, Linkwitz Transform etc., anything with a positive gain) then you got a 24 dB headroom for amplification BUT you have to attenuate it down below 0 dB again before it leves the DSP core or it will be clipped.
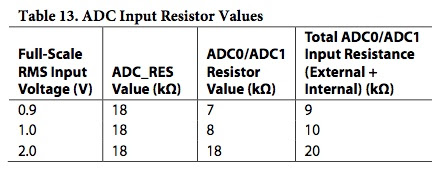
dB is a relative unit so its better to talk about dBFS in the digital domain and we also need to be able to relate it to something like dBV in the analog domain. We know the full scale rms input voltage because it is given by Table 13 on page 20 of the ADAU1701 Data Sheet.
We also know that the
DSP from 3e Audio is configured for an input sensitivity of 1.0 Vrms (i.e. 8k ADC0/ADC1 resistors). So 1.0 Vrms on the input represents 0 dBFS in the DSP core. Anything above 1.0 Vrms vill clip the input signal. So the first thing we should do is to make sure no signal source is hotter than 1.0 Vrms. I measured 0 dB (-3 dB rms) on the
level detector in SigmaStudio feeding the DSP with a 1kHz signal at 1.0 Vrms. Playing music material from the same source with the same amplification resulted in approximately -8 dB level on the
level detector with very few peaks hitting the 0.0 dB level.
The output level is easier to measure thanks to the built in
signal generator. It is generating a 0 dBFS signal so set it to 1kHz and measure the voltage on the output. The specification for the output DACs can be found on page 21 in the
ADAU1701 Data Sheet, it reads:
The ADAU1701 includes four Σ-Δ DACs. The SNR of the DAC is 104 dB, and the THD + N is −90 dB. A full-scale output on the DACs is 0.9 V rms (2.5 V p-p).
So 0 dBFS in the DSP core represents 0.9 Vrms output from the DAC. This is then amplified on the DSP from 3e Audio. I measured 1.533 (true) Vrms single ended and 3.075 (true) Vrms differential output. That represents +4.626 dB from 0.9 Vrms single ended and +10.672 dB for differential output. And from 1.0 Vrms input they are +3.710 dB single ended and +9.757 dB for differential output.
To sum it up for the
DSP from 3e Audio, no more than 1.0 Vrms on the input, no more than 0 dBFS out of the DSP core and output max 1.533 Vrms if connected single ended to the power amp or 3.075 Vrms if connected with differential output (only if the amplifier supports it). With max input and output levels sorted its easy to prevent clipping and to match input sources and output power amplification.
I will be driving the
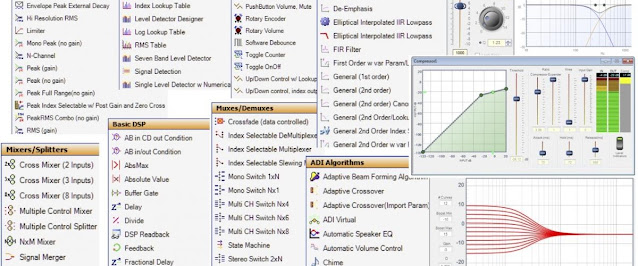
Single Slew External Volume Block from a potentiometer through one of the DSPs Aux ADCs. The position of the potentiometer will be represented by a value of 0.0 to 1.0 by the ADC. But what dB attenuation does each position represent? One way to find out is using the
signal generator and a
level detector in SigmaStudio. But the readout from the level detectors are quite corse. An alternative method is to use the
undocumented Log LUT. I used both and compared the readout from each of them. I made a table based on the following values for the Lower Range (-90 to +6 dB) Log LUT:
Table Row | Required Input | dB |
1 | 0,0000305 | -90,3 |
2 | 0,0000431 | -87,3 |
3 | 0,000061 | -84,3 |
4 | 0,0000864 | -81,3 |
5 | 0,0001221 | -78,3 |
6 | 0,000172 | -75,3 |
7 | 0,0002441 | -72,2 |
8 | 0,0003452 | -69,2 |
9 | 0,0004883 | -66,2 |
10 | 0,0006905 | -63,2 |
11 | 0,0009766 | -60,2 |
12 | 0,001381 | -57,2 |
13 | 0,001953 | -54,2 |
14 | 0,002762 | -51,2 |
15 | 0,003906 | -48,2 |
16 | 0,005523 | -45,2 |
17 | 0,0078125 | -42,1 |
18 | 0,011045 | -39,1 |
19 | 0,015625 | -36,1 |
20 | 0,0221 | -33,1 |
21 | 0,03125 | -30,1 |
22 | 0,04419 | -27,1 |
23 | 0,0625 | -24,1 |
24 | 0,08839 | -21,1 |
25 | 0,125 | -18,1 |
26 | 0,17678 | -15,1 |
27 | 0,25 | -12,0 |
28 | 0,3534 | -9,0 |
29 | 0,5 | -6,0 |
30 | 0,7071 | -3,0 |
31 | 1 | 0,0 |
32 | 1,4142 | 3,0 |
33 | 1,9994 | 6,0 |
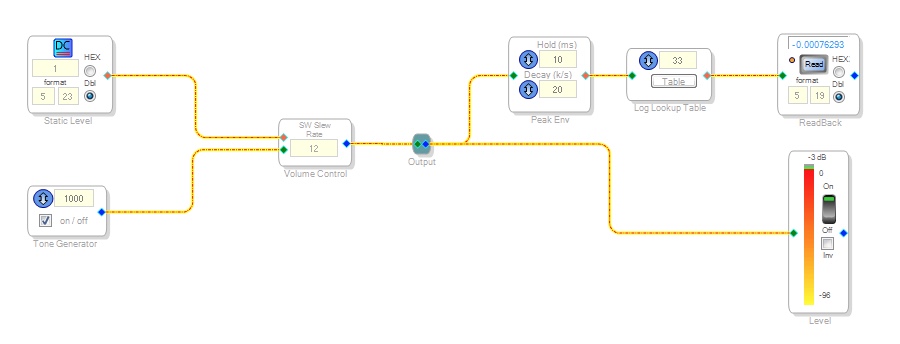
The table was populated with dB/10 values per row to get an intepolated decimal readout, e.g. Table row 1 was specified as -9.03 and so on. I then used a
DC Input Entry instead of the Aux ADC to be able to set a precise static value used as the external input on the
Single Slew External Volume Block. This is the readout from the
level detector and the Log LUT for 0.0 as the external input. The level detector reads -96 dB and the Log LUT -9.03 (i.e. -90.3 dB).
And the readout with 1.0 as the external input. The level detector reads -3 dB and the Log LUT -0.0 (i.e. 0 dB). The difference is probably because I used a
Peak Envelope for the Log LUT and I guess the level detector readout is rms.
A quick run trough 0.0 to 1.0 in increments of 0.1 gives the following results:
Static Level | dB Level Detector | dB Log LUT |
0,0 | -96 | -90 |
0,1 | -23 | -20,2 |
0,2 | -17 | -14,2 |
0,3 | -13 | -10,7 |
0,4 | -11 | -8,2 |
0,5 | -9 | -6,0 |
0,6 | -8 | -4,7 |
0,7 | -6 | -3,1 |
0,8 | -5 | -2,2 |
0,9 | -4 | -1,2 |
1,0 | -3 | 0 |
And as a graph:
We can use
Alexander Thomas approximations to populate the Slope and Step tables.
Alexander Thomas seems to prefer the ^4 approximation for a 60 dB range but I also added ^3 and ^2 in the table below.
Aux ADC | Index | Gain (^2) | dB (^2) | Gain (^3) | dB (^3) | Gain (^4) | dB (^4) |
0,0 | 1 | 0,0 | -∞ | 0,0 | -∞ | 0,0 | -∞ |
0,1 | 2 | 0,01 | -40 | 0,001 | -60 | 0,0001 | -80 |
0,2 | 3 | 0,04 | -28 | 0,008 | -41,9 | 0,0016 | -55,9 |
0,3 | 4 | 0,09 | -20,9 | 0,027 | -31,4 | 0,0081 | -41,8 |
0,4 | 5 | 0,16 | -15,9 | 0,064 | -23,9 | 0,0256 | -31,8 |
0,5 | 6 | 0,25 | -12 | 0,125 | -18,1 | 0,0625 | -24,1 |
0,6 | 7 | 0,36 | -8,9 | 0,216 | -13,3 | 0,1296 | -17,7 |
0,7 | 8 | 0,49 | -6,2 | 0,343 | -9,3 | 0,2401 | -12,4 |
0,8 | 9 | 0,64 | -3,9 | 0,512 | -5,8 | 0,4096 | -7,8 |
0,9 | 10 | 0,81 | -1,8 | 0,729 | -2,7 | 0,6561 | -3,7 |
1,0 | 11 | 1,0 | 0,0 | 1,0 | 0,0 | 1,0 | 0,0 |
And in graph form:
Now set up a spread sheet to
do the math for you and its easy to make pretty much any curve of your liking. For example the
Alexander Thomas ^3 approximation from above:
Aux ADC | Index | dB | Linear Gain | Slope Table | Step Table |
0,0 | 1 | -90 | 0,00003 | 0,0097 | 0,00003 |
0,1 | 2 | -60 | 0,001 | 0,0704 | -0,00604 |
0,2 | 3 | -41,9 | 0,00804 | 0,1888 | -0,02972 |
0,3 | 4 | -31,4 | 0,02692 | 0,3691 | -0,08381 |
0,4 | 5 | -23,9 | 0,06383 | 0,6062 | -0,17865 |
0,5 | 6 | -18,1 | 0,12445 | 0,9182 | -0,33465 |
0,6 | 7 | -13,3 | 0,21627 | 1,265 | -0,54273 |
0,7 | 8 | -9,3 | 0,34277 | 1,7009 | -0,84786 |
0,8 | 9 | -5,8 | 0,51286 | 2,1996 | -1,24682 |
0,9 | 10 | -2,7 | 0,73282 | 2,6718 | -1,6718 |
1,0 | 11 | 0 | 1 | 3,6458 | -2,6458 |
1,1 | 12 | 2,7 | 1,36458 |
|
|
And this is what it looks like 0.0 to 1.0 in increments of 0.1 measured as before with the Log LUT:
Aux ADC | Index | ^3 dB |
0,0 | 1 | -90 |
0,1 | 2 | -60 |
0,2 | 3 | -41,9 |
0,3 | 4 | -31,4 |
0,4 | 5 | -23,9 |
0,5 | 6 | -18,1 |
0,6 | 7 | -13,3 |
0,7 | 8 | -9,3 |
0,8 | 9 | -5,8 |
0,9 | 10 | -2,7 |
1,0 | 11 | 0 |
And as a graph:
It actually measures as expected and its much better than before. Here is another example of how a simple spread sheet can be used. Its a pretty nice compromise for a more logarithmic curve (its the one Im using):
Aux ADC | Index | dB | Linear Gain | Slope Table | Step Table |
0,0 | 1 | -60 | 0,001 | 0,0401 | 0,001 |
0,1 | 2 | -46 | 0,00501 | 0,0912 | -0,00411 |
0,2 | 3 | -37 | 0,01413 | 0,1749 | -0,02085 |
0,3 | 4 | -30 | 0,03162 | 0,2461 | -0,04221 |
0,4 | 5 | -25 | 0,05623 | 0,4377 | -0,11885 |
0,5 | 6 | -20 | 0,1 | 0,5849 | -0,19245 |
0,6 | 7 | -16 | 0,15849 | 0,927 | -0,39771 |
0,7 | 8 | -12 | 0,25119 | 1,4692 | -0,77725 |
0,8 | 9 | -8 | 0,39811 | 2,3285 | -1,46469 |
0,9 | 10 | -4 | 0,63096 | 3,6904 | -2,6904 |
1,0 | 11 | 0 | 1 | 5,8489 | -4,8489 |
1,1 | 12 | 4 | 1,58489 |
|
|
And as a graph:
This is now my updated "Volume Control" Hierarchy Board. Any EQ or internal amplification within the DSP core at 0 dBFS is kept < 10 dB. The speaker output got a compressor with a soft knee to
manage anything > 0 dBFS. The headphone output is attenuated 12 dB (to protect hearing and match my AKG K550) so no compressor is needed.
DSP is now performing properly as a preamp and I am happy but almost out of MIPS...