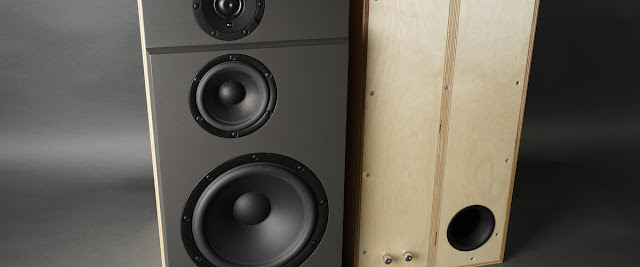
Ortho Acoustic WAW, update 1.

The speakers are done but I want to replace the plate amps with a regular amp and some application of Rod Elliot's P48a. I already know how the W5-2143 measures near field from my fun with foam core but I wanted to do new near field measurements for it in this new enclosure. I measure f3 to be around 89 Hz (and f6 69.6 Hz).

I had only measured the ARGSUB840 through the plate amp (with its built in filters) before so I had to remeasure it too but this time fed from the same test amp as the W5-2143. This was the result and I measure f3 to be around 53.2 Hz (and f6 42.3).

I also wanted to know the difference in sensitivity between the W5-2143 and the ARGSUB840. I used near field measurements with elements of different sizes so the results have to be scaled to each other. You can calculate it manually or let software like VituixCAD do it for you.
I started by exporting the measurements from REW because I am going to use VituixCAD for some further analysis. I then used the Merger tool and punched in the Sd of the W5-2143 and the diameter of the ARGSUB840 (since I don't know the Sd of the driver, I measured the diameter from half the surround). VituixCAD calculated the Sd to 213.8 cm2 (seems reasonable for an 8 inch element). You can also see what VituixCAD calculated in the Scale dB column and that there is a 3.6 dB difference between the W5-2143 and the ARGSUB840 (it was the same as I calculated by hand). So we need to scale the measurement of the W5-2143 down by -3.6 dB.

You can use the Calculator tool in VituixCAD to generate a new scaled data file if you need.

I now created a new project in VituixCAD and added two drivers. I did not use the scaled file from the Calculator tool, I used the measure data and used the "Scaling" field instead to apply -3.6 dB for the W5-2143 (it is just another way of doing it).

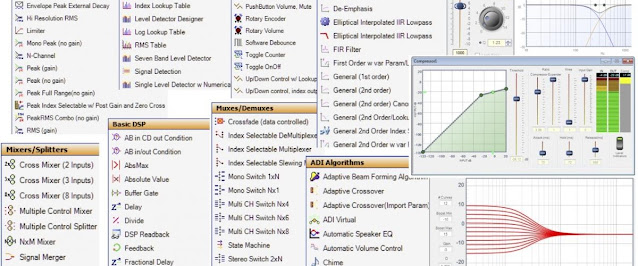
You will not get a response graph as in the screenshot above without first
defining a crossover. It doesn't have to be a crossover but you have to
at least connect the elements to a source at the crossover tab.

I can now visualize the raw response from each driver and I can use the crossover components in VituixCAD to simulate the effect of the P48a circuit to get a rough estimate of how the drivers might sum up in the crossover section.
Another option is to use a program like TINA-TI and simulate the P48a circuit. Then export the response and use it in VituixCAD. I just tried it but the exported data from TINA-TI lack phase information so I need to add some dummy data to get VituixCAD to accept the file as the response for the LF element.
Do you wounder how this speaker measure in room? I did but how on earth do you measure an ortho-acoustic speaker? Troels seems to have had the same problem when he tried to measure an OA5. I came to pretty much the same conclusions as I tried to make some quick in room measurements while I did my near filed measurements. Using normal quasi-anechoic methods generates the same horrible graphs as the ones Troels measured even though the speakers sound great. Maybe not from a strict audiophile perspective, I would not call them uncolored or totally flat. But they do sound different in a good way and my best description would be "musical". I guess some of the answer to this riddle can be found in this paper. So I will continue this journey just to discover where it might take me...