Arduino Goes to Town, Part 4.
We now got a "display" with a resolution of 32 x 8 "pixels". Next up is code for the spectrum analysis. It would be natural to use FFT but the Arduino Uno is no power house so I am going to use FHT instead. You will not find this library in the official repository but it is an amazing library so add it manually to the libraries in your Arduino sketchbook. The FHT works very similar to the FFT but first, lets take a closer look at the problem. I want to visualise the spectrum of music with a max resolution of 32 x 8.
I first have to sample the music with the Arduino ADC through my sound interface. The frequency range of music is somewhere between 20 Hz to 20 kHz. That would make the Nyquist frequency 20 kHz and I would have to sample at 40 kHz. First problem, the Arduino built in analogRead() function isn't that fast. It is roughly 9600 per second with the default 128 ADC prescaler. There are many ways to get a higher sample rate but I will just change the prescaler to 32. It will give acceptable readings at a sample rate of roughly 38 kHz. You now understand why I went with a 18kHz low pass filter on my sound interface.
There are many examples of how to change the prescaler to 32 but most are hardcoded to use the A0 pin. I want to be able to use more than one pin because I got an LDR in my amp and I want to use it to set the overall intensity of the display. I also want to read some noise from a floating pin as input seed to the randomSeed() function. So I put together the following two functions to manage the ADC:
// set adc channel
void adcSet(byte channel) {
static byte adcChannel = 0xFF;
if (adcChannel == 0xFF) {
adcChannel = channel;
DIDR0 |= B00111111; // disable digital input pins
ADMUX = B00000000 | adcChannel; // AREF, right-adjust, channel
ADCSRA = B10100101; // enable ADC, auto-trigger, prescaler 32
} else if (channel != adcChannel) {
adcChannel = channel;
ADMUX = B00000000 | adcChannel; // AREF, right-adjust, channel
ADCSRA |= B01000000; // start ADC conversion
while (!(ADCSRA & B00010000)); // wait for adc to be ready
ADCL | (ADCH << 8); // skip sample from old channel
}
}
// return one adc sample
int adcGet() {
ADCSRA |= B01000000; // start ADC conversion
while (!(ADCSRA & B00010000)); // wait for adc to be ready
return ADCL | (ADCH << 8); // must read low first
}
adcSet() is used to enable and set the ADC to a given channel 0..7 (not A0..A7). adcGet() is used to read one sample from the channel set. Everything else is hardcoded (prescaler, external AREF etc.). The resolution of the Arduino ADC is 0..1023 and I am using 3.3V as AREF so each step on the ADC represents 3.2 mV (3.3/1024). The ADC can only read positive voltages so the sound interface has a DC offset of 1.65 V (3.3/2). Max peak-to-peak measurable is 3.3 V, max peak 1.65 -> 1.16 Vrms. An ADC reading of 1023 -> 1.16 Vrms and 0 -> -1.16 Vrms.
So we need to read the ADC and subtract the offset. A lot of code does something like aval -= 0x0200, i.e. subtract 512. It could work but the midpoint might be a bit off or fluctuate a bit so it is better to calculate an average of all the samples and subtract the average from the reading. It eliminates the need for calibration and trimpots. My sample function therefor ended up something like this:
#define FHT_N 128
#define SND_ADC_CHANNEL 0
#define SND_SAMPLES FHT_N
#define NOISE_THRESHOLD 2
// take sound samples
void sampleSnd() {
int i;
int value;
long avg = 0;
adcSet(SND_ADC_CHANNEL);
for (i = 0; i < SND_SAMPLES; i++) {
value = adcGet(); // get sample
fht_input[i] = value; // put into FHT input
avg += value; // add for avg
}
avg /= SND_SAMPLES; // avg -> voltage offset
for (i = 0; i < SND_SAMPLES; i++) {
value = fht_input[i]; // get from FHT input
value -= avg; // remove voltage offset
value = abs(value) > NOISE_THRESHOLD ? value : 0; // filter some noise
value <<= 6; // to FHT max resolution
fht_input[i] = value; // put into FHT input
}
}
So thats it, sampling at 38 kHz and feeding the FHT input. The FHT library offers great options and functionality but what is most suitable for this use case? It is vital to understand the concept of FFT/FHT to answer that question. So if you are new to the FFT/FHT concept start by reading Fast Hartley Transformation Library for AVR microcontrollers by Simon Inns.
You can then write a piece of code that generates a perfect sine wave at a certain frequency with a max amplitude and feed it through the FHT to get a better understanding of what to expect as output. You can also feed white noise through the FHT and you will realise that the output is pretty constant between bins except for the first and last one. You will also realise that a higher N value will increase the resolution since the bandwidth of each bin is narrower but the total energy is shared over all bins so the energy level in each bin will be smaller. So you have to come up with a suitable compromise, enough resolution without consuming to much resources.
I would like to use the full horizontal resolution to visualise the music spectrum. It would make up 32 bands. An N value of 64 would give me 32 bins but the first and last are quite useless. The frequency resolution is also a bit coarse with bins centre frequenzy spaced almost 600 Hz apart. But we have another problem. Humans perception of sound and energy distribution in music. Since humans perceive sound more logarithmic than linear a logarithmic scale is usually used for the sound spectrum. The FHT library got an option for output the RMS value of the bins in an octave (doubling of frequencies) format. But this function will only output 8 bands for an N value of 256 (FHT_N = 256 : bins = [0, 1, 2:4, 5:8, 9:16, 17:32, 3:64, 65:128]) and it includes the first and last bins. So how could I come up with 32 bands on a logarithmic scale without consuming excessive resources?
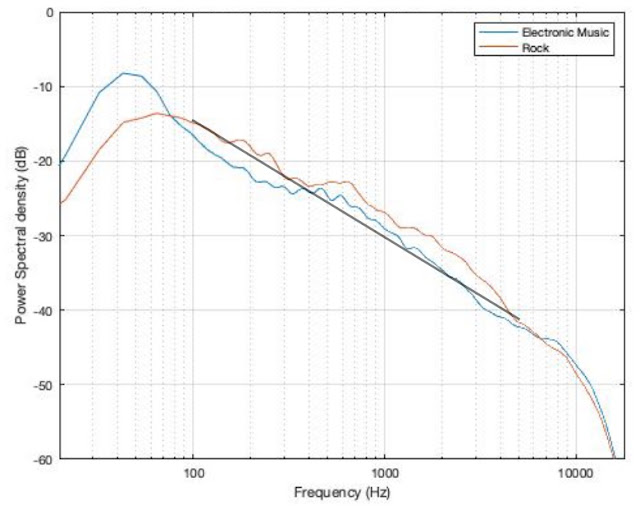
My idea is to equalise a linear output into a logarithmic response. But what would be a good EQ curve? Using an A-weighting might be good over the full audio spectrum to visualise perceived loudness but what about music? I tried to measure it myself but what is representative music? I finally came across the Target Spectrums For Mastering by Oscar Schedin. Really interesting read about mastering but also a lot of information about the spectral character of music. I found what I was looking for in Figure 6:
So music got a declining spectral slope of around 5 dB/octave and there is very little energy above 10 kHz. An N value of 128 would give me 62 useful bins if I discard the first and last bin. The bins will be spaced approximately 297 Hz apart (sample rate 38,000/128). The centre frequency of bin 1 would be 297 Hz and 9500 Hz for bin 32. So one approach would be to use bin 1..32 as bands and amplify each band 5 dB/octave. Let 0 dBFS be 250 Hz (first octave below centre frequency of bin 1) and calculate 5 dB/octave gain for each bin; 297 Hz -> 0.9 dB, 594 Hz -> 5.9 dB and so on all the way up to 9500 Hz -> 25.9 dB.
We now got the dB gain needed for each band but amplifying on the fly using floating points will be quite costly on the Arduino Uno. So how can it be done with integer math? The final display resolution will be only three bit. The eight bit linear FHT with a scaling factor of 128 is quite efficient for N = 128. The max output value will be 255 so my approach is to calculate a lookup table for each band and use the map() function to scale the result. A max value of 255 out of bin 1 amplified 0.9 dB -> 283 and 255 out of bin 32 amplified 25.9 dB -> 5030. So the amplified value is well within an int. I can now map each band using 255 as the fromHigh value and the lookup table value as the toHigh value. I clamp the result back to eight bit using the constrain() function (truncating anything above 255). This is far from perfect but it is efficient and works surprisingly well for music.
There is one final thing we could do to increase the output resolution on the display. We can min-max scale the result but it is also costly to do using floating points. So I once again use the map() function to do it with integer math. This is what my function looks like:
// integer min-max scaling to resolution
byte scaleMinMax(byte value, byte minValue, byte maxValue, byte resolution) {
return (minValue < maxValue) ? map(value, minValue, maxValue, 0, resolution) : 0;
}
To sum it up. I sample input for the FHT @ 38 kHz, run the FHT as eight bit linear with N = 128 and scaling = 128, takes result from bin 1 to 32, amplifies result by pre-calculated LUT value, clamp value back to eight bit, check for min and max value and finally min-max scale each band to maximise resolution to a value between 0 (no sound) and 8 (max amplitude). Only 1..8 will show up on the display.
I use the Adafruit NeoPixel library to draw on the LED display. FastLED in another capable library but the NeoPixel library consumes way less resources and is good enough for this use case. There is a separate library to handle matrixes but I only need a x/y plotter so I replaced the need for the library with the following function:
#define XRES 32
#define YRES 8
// map x,y to pixel offset
int pixel(byte x, byte y) {
int i = XRES * (YRES - y);
return (y & 0x01) ? i - XRES + x : i - 1 - x;
}
int i = XRES * (YRES - y);
return (y & 0x01) ? i - XRES + x : i - 1 - x;
}
I also made a couple of colour oriented functions:
// get rainbow hue for band
unsigned int getRainbowHue(byte band) {
return band << 11;
}
// get hue from color cycle
unsigned int getNextHue() {
static unsigned int hue = 0;
hue--;
return hue;
}
The first one will return a rainbow hue for band number. Note that every array will be zero indexed so bins will be remapped to band = 0..31, matrix x = 0..31 and matrix y = 0..7. The second function will return a new hue value each time it is called. I use it to slowly cycle colours in the normal display mode.
We now got most pieces needed to write the final program. Code to sample the ADC, to execute FHT, to scale output values for each band and to draw the result on the LED matrix. Next up is to piece everything together, stay tuned...
Note: I changed approach in the final code using 16 bit linear output instead of 8 bit with an updated LUT.


